Slurm was the easy part: a batch scheduler on an EDA estate
Standing up Slurm on a chip design company's compute estate took a day. Almost none of that day was spent on Slurm. It went on a hardened OS, an ageing systemd, identity, DNS, NFS netgroups, and a monitoring stack that failed without saying so.
- The premise, and why the obvious reading was wrong
- Measuring twice, and being wrong twice
- cgroup v2 is effectively unavailable to Slurm on EL8
- The rest of the environment, in roughly the order it broke
- Memory enforcement: the failure that does not announce itself
- Monitoring that fails silently
- Identity, DNS and NFS
- Three things that only bite users
- Cores were never the constraint
- What I would do differently
- What’s next
Real client work, anonymized. Generic hosts and roles throughout, and no estate details that would identify anyone. Tool names are industry-standard products, not identifying information.
A chip design company had roughly 450 hardware threads sitting at about 6% utilisation while its engineers queued behind each other on two interactive machines. That is the kind of number that makes a batch scheduler look obvious. I built one in a day: a controller, two compute nodes, accounting, and a monitoring stack.
Slurm was the easy part. Nearly every hour went somewhere else, into a hardened OS image, a systemd too old for the cgroup mode Slurm wants, an identity system, DNS, NFS netgroups, and a monitoring stack that failed without producing a single error. This is the writeup I wanted before I started.
I spent a while last year building a fake cluster in a homelab precisely so that this day would not be the first time I did it. That helped. It did not help with any of what follows, because none of what follows is about Slurm.
The premise, and why the obvious reading was wrong
The utilisation graphs showed idle machines. They were not idle machines. They were machines with idle CPU that people were logged into, with held desktop sessions accumulating on the interactive workstations. Roughly 95 sessions sat against that single-digit CPU average.
That distinction decides the design. If the capacity is headroom inside machines people are
using, you cannot install slurmd on the quietest-looking hosts and start scheduling onto them,
because you will land batch jobs on top of someone’s session. The capacity had to come from
dedicated batch nodes on the one host with idle CPU, free memory, and no interactive users.
Low CPU does not mean a free machine
A CPU graph answers one question: how busy were the cores. It does not tell you whether anyone is sitting on the box, how much memory is committed, or how many sessions are held open. On this estate, memory was the binding constraint nearly everywhere, and CPU was the only thing anyone had been looking at. Before you place a workload, check occupancy and memory commitment, not just CPU. They frequently disagree, and the disagreement is the interesting part.
Measuring twice, and being wrong twice
The secondary theme of this project, and the part I would most want a reader to take away, is that I reached a confident conclusion from bad data twice and had to retract it both times.
The first retraction was the one above. Low CPU reads as spare capacity until you count sessions.
The second was worse. I analysed years of archived licence checkout logs to work out which workloads were batch-shaped, and concluded clearly that the place-and-route tooling was not, barely a percent of its licence-hours in long runs. I wrote that up.
Then I looked at what was running right now on the two busy machines, and found heavy multi-day scripted runs of exactly the tooling I had just ruled out. The historical window predated the current project phase. The data was real, the parsing was correct by then, and the conclusion was still wrong, because the sample came from a different era of the company’s work.
Stale data, confidently analysed, is worse than no data
No data makes you go and look. Stale data makes you write a plan. Earlier passes had also produced two parser bugs worth naming: inferring midnight rollovers from a log that several daemons write to concurrently, so it is not globally monotonic, which invented multi-week checkouts; and treating feature names case-sensitively, which split one licence pool into two queues so a check-in could pair with a checkout from weeks earlier. Distrust your own measurements, especially the ones that agree with your plan.
The live process scan also produced the single most useful thing I found all day. The long place-and-route invocations looked like this:
$ ps -eo args | grep -i innovus
innovus -lic_startup invs -wait 100 -cpus 16 -file ./scripts/Placement.tcl -log ./logs/place_opt.log
-wait 100 tells the tool to block for up to 100 minutes waiting for a licence. The engineers
had already hand-rolled a queue, badly: the process squats on the machine and polls, holding the
memory and the session the whole time. That is direct measured evidence for licence-aware
scheduling, and it came from ps, not from a spreadsheet.
Everything long-running was already a scripted, non-interactive invocation. These were batch jobs
missing only a scheduler, so wrapping them in sbatch was close to a no-op for the user. That is
the best predictor I know that a rollout gets adopted.
cgroup v2 is effectively unavailable to Slurm on EL8
This is the finding worth the post on its own, because the error message points at the wrong layer entirely.
Slurm is deprecating its cgroup v1 plugin, so a new deployment should be v2. On RHEL 8 and its rebuilds, you cannot have it. The distribution ships systemd 239. Support for the cgroup v2 CPU controller landed in systemd 244. Enable the unified hierarchy and the kernel will not let you delegate the controller:
$ echo +cpu > /sys/fs/cgroup/cgroup.subtree_control
write error: Invalid argument
And then slurmd refuses to start:
error: cpu cgroup controller is not available
That message reads like a missing Slurm plugin. It is nothing of the kind. It is a delegation
limit in a systemd five releases too old, surfacing through Slurm. No amount of cgroup.conf
editing fixes it. Slurm still ships cgroup_v1.so, so v1 works, and on EL8 that is your only
option.
The mixed-OS consequence people miss
EL8 nodes must run cgroup v1 and EL9 nodes should run v2, and the setting lives in
cgroup.conf, which is part of the configuration every node shares. So an EL8 node and an
EL9 node cannot sit in the same pool with one config. A mixed-OS compute pool has to
migrate in a single step, not host by host. That is a scheduling and change-management
constraint that arrives from a systemd version number, and it is worth knowing before you
promise a phased rollout.
The rest of the environment, in roughly the order it broke
None of these are hard. All of them cost time, because each one presents as something other than what it is.
/tmp mounted noexec breaks rpmbuild. Slurm is not packaged in the base repositories,
so you build it. The build fails with ./configure: Permission denied, which reads like a file
permission problem and sends you to chmod. The configure script is being extracted to /tmp
and executed from there, and the mount option forbids it. Point TMPDIR somewhere executable.
The repository holding most -devel packages ships disabled. It is powertools on EL8 and
crb on EL9, and it is where the build dependencies live.
rpm -q python3 fails on EL8 even when Python 3 is installed, because the package is named
for its minor version. Any prerequisite check written as rpm -q python3 reports a missing
dependency that is sitting right there.
firewalld blocking the scheduler ports leaves nodes in state unknown* with every job
stuck PENDING. The controller cannot reach slurmd, and the entire diagnostic signal is a
single asterisk in sinfo output. If you learn one piece of Slurm trivia from this post, make
it that asterisk.
Collected, because the pattern is the point:
| What it looked like | What it actually was |
|---|---|
| Missing Slurm cgroup plugin | systemd too old to delegate the CPU controller |
| File permission bug in the build | /tmp mounted noexec |
| Missing Python 3 | Package named python3x, query was wrong |
Missing -devel packages |
Repository present but disabled by default |
| Node down, scheduler broken | Firewall, announced by one asterisk |
| Memory limits not applied | Limits applied correctly, swap unconstrained |
| Grafana panel with no data | Two queries sharing a refId |
| Metric disappeared | A stray 0 made the whole textfile unparseable |
Every row is the same shape. The error names the layer where the symptom surfaced, not the layer where the cause lives.
Memory enforcement: the failure that does not announce itself
This one is subtle enough that I would have shipped it broken.
Setting ConstrainRAMSpace=yes in cgroup.conf does not, by itself, enforce a memory limit.
I tested it the obvious way: submit a job with --mem=1G, have it allocate 2G, and watch it
die. It did not die. It ran to completion.
The RAM limit had been applied correctly. But memsw, the combined memory-plus-swap limit, was
unlimited, so the kernel did the reasonable thing and swapped. You need both:
ConstrainRAMSpace=yes
ConstrainSwapSpace=yes
Swapping instead of dying is the worse failure
A job that exceeds its memory and gets killed produces a clear signal: it failed, the reason is in the log, the owner fixes the request. A job that swaps does not fail. It silently becomes many times slower and degrades every other job on the node through I/O contention, and nobody is told why. On a fleet running multi-day jobs with tens of gigabytes resident, that is the difference between a bad afternoon and a week of unexplained slowness. Test enforcement by exceeding the limit and confirming the job dies. “No error” is not a pass.
Monitoring that fails silently
The monitoring stack produced more silent failures than anything else, which is a bad property for the thing whose entire job is telling you what happened.
Grafana renders a panel as “No data”, with no error, when two queries in that panel share a
refId. Every single-query panel worked. Every multi-query panel was blank. There is no
warning in the UI and nothing in the logs. I found it only because someone sent me a screenshot
of the dashboard and I noticed which panels were empty.
PromQL will not divide those two series. The obvious expression returns nothing at all:
slurm_memory_bytes{state="allocated"} / slurm_memory_bytes{state="total"}
Binary operators match on the full label set, and these two differ in the very label you are selecting on, so nothing matches and you get an empty result rather than an error. You have to tell it to ignore that label:
slurm_memory_bytes{state="allocated"}
  / ignoring(state) slurm_memory_bytes{state="total"}
grep -c prints a count and exits 1 when that count is zero. In a collector script writing
a Prometheus textfile, the defensive-looking count=$(grep -c pattern file || echo 0) appends a
second 0 on its own line when there are no matches. That makes the textfile unparseable, and
Prometheus then drops every metric in that file, not just the broken one. One bad line takes
out the whole collector.
Absence and zero are indistinguishable, so say you are alive
In Prometheus, a metric that is missing and a metric that is genuinely zero look the same from a dashboard: an empty panel. So a collector that dies produces the same picture as a cluster with nothing running, which is exactly the picture you would expect at 3am. Every collector should emit an unconditional heartbeat, a timestamp or a scrape counter that is written whether or not there is anything else to report. Then alert on the age of that metric, not on the absence of the interesting ones.
That is the “Collector Age” panel in the top row here, and it earns its place:
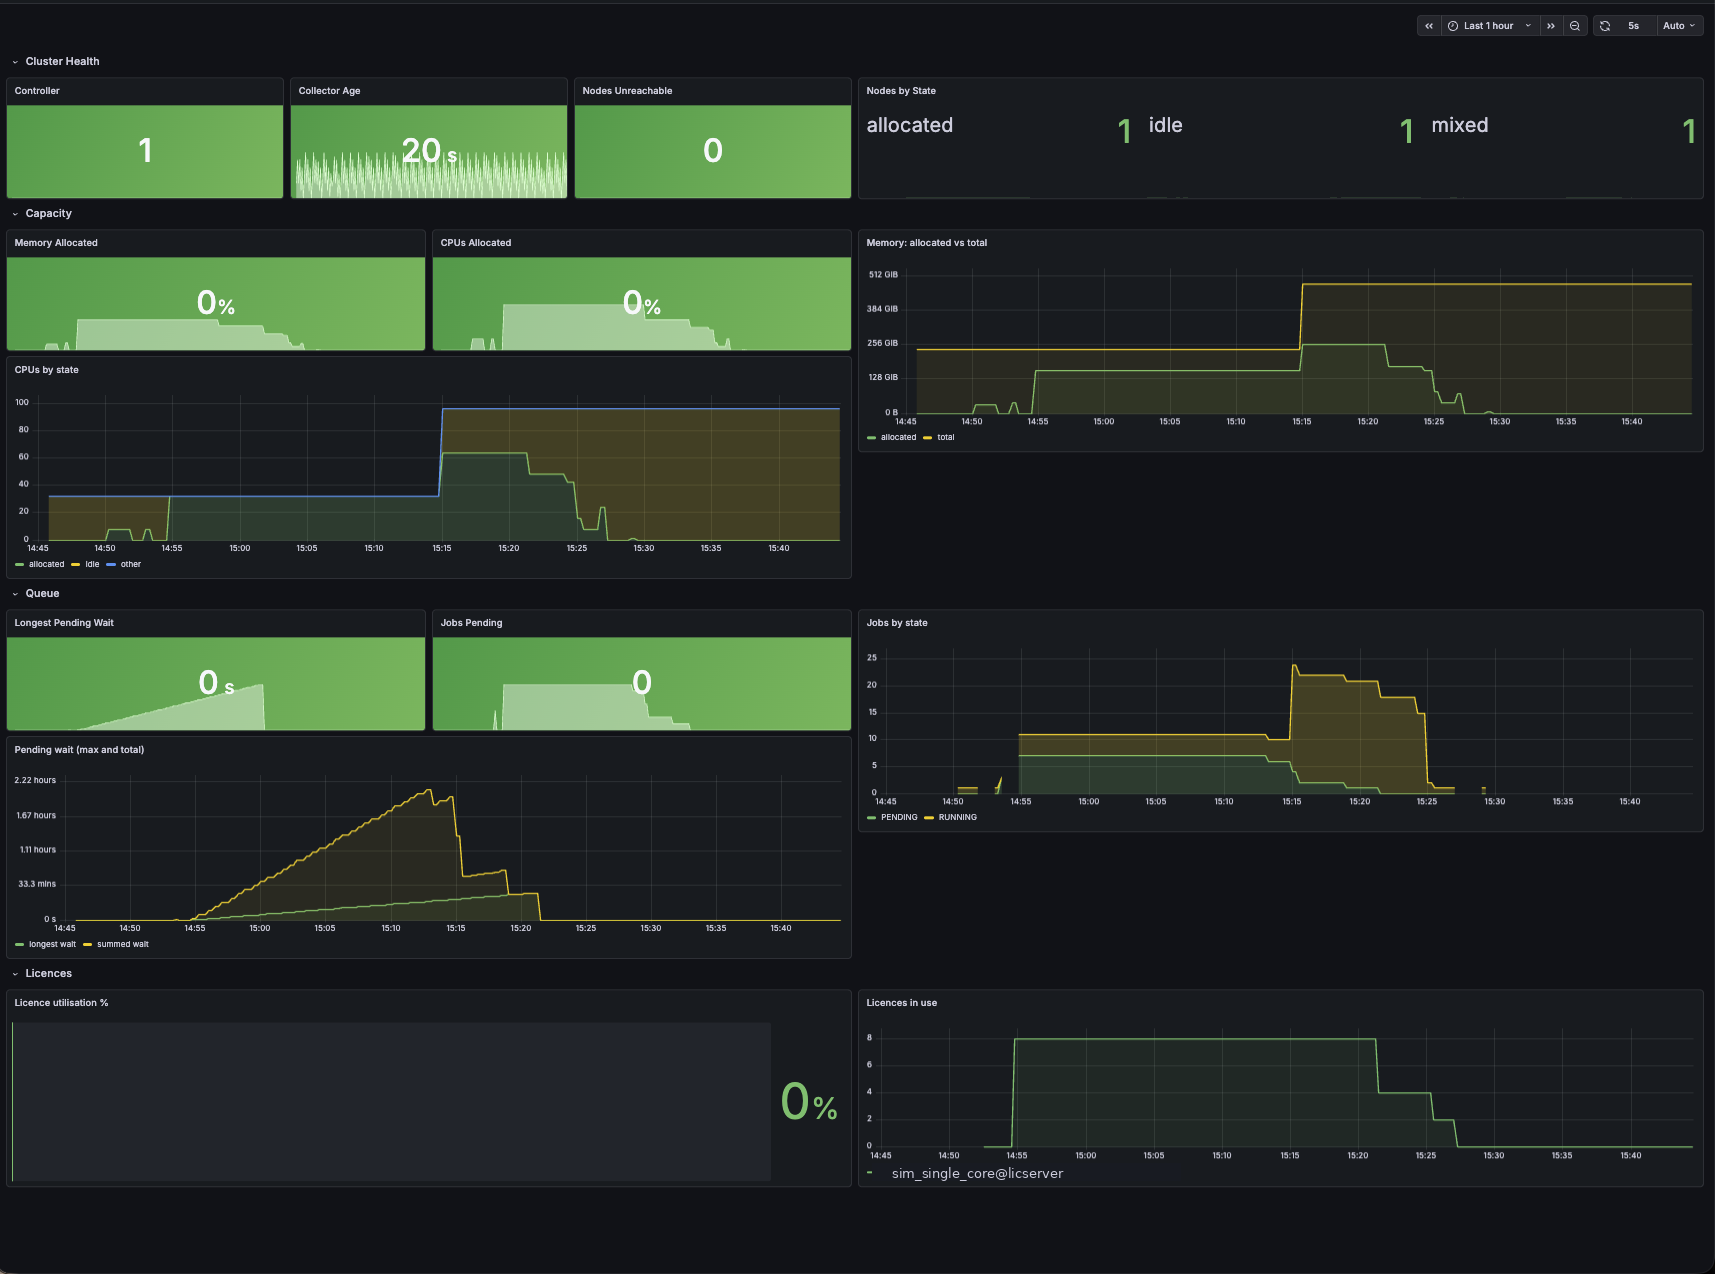
The bottom two rows are the ones that mattered to the argument. The queue panels show jobs pending and how long the longest one has waited. The licence panels show utilisation and checkouts in use, which is the constraint that actually governs this estate.
Identity, DNS and NFS
Group-keyed sudo rules from the directory service did not resolve. A rule naming a local user applied immediately. A rule granting the same rights to a group did not, on a host that was otherwise correctly enrolled and resolving users and groups fine. That has implications well beyond this project, because fleet-wide administrative access was configured group-wise, and I have not yet established how far it extends.
The identity client’s enrolment command exits non-zero when it cannot update DNS. A different server owned DNS here, so enrolment succeeded and then returned a failure code for the DNS step. The site provisioning script treated any non-zero exit as fatal and aborted, after a successful enrolment, skipping the entire second half of its configuration. The host looked enrolled and was half-configured.
A new NFS client needs manual netgroup membership and a cache flush, on every NFS server separately. One share came from a different server than the rest, so flushing the obvious one left the node with most mounts fine and one refusing. Enumerate your exports by server before you start.
Three things that only bite users
Batch jobs do not read .bashrc. The environment module setup every interactive shell gets
for free is simply absent, so job scripts have to source it explicitly. The failure presents as a
tool that “is not installed” on a node where it plainly is.
module load X | head silently loses the environment change. module is a shell function
that modifies the current environment, and a pipe runs it in a subshell, so the change is applied
and then discarded. It prints what you expect and does nothing.
Remote licence resources must be requested with an @server suffix, or the job is rejected
as an invalid licence specification.
Cores were never the constraint
Here is the architectural point, and it is the reason the project is not really about adding compute.
During a demo the cluster showed jobs queued for two different reasons at once. Some were blocked on hardware. More were blocked on licences. The place-and-route features sit around 80% occupancy in normal use, and that is before a scheduler starts packing work in.
Adding cores does not help a licence-bound workload. It makes things worse. A scheduler that fills a node with jobs that then fail at licence checkout has converted a queue into a pile of failures, and it will get blamed for the outage.
Slurm can track licences, and you should use it, but be clear about what it is: bookkeeping against a number you declare. It does not query the licence manager, and it cannot see checkouts made outside the scheduler, which here is most of them, because the interactive users are still working.
Declare fewer licences than you own
Slurm’s licence count is an assertion, not an observation. If you declare the true count, the scheduler will believe every licence is available to it and dispatch accordingly, while interactive users hold a third of them. The jobs fail at checkout, which looks exactly like a broken scheduler. Set the declared count below the real one, and treat the gap as the interactive users’ reserve. Revisit it with measured occupancy rather than guessing.
The corollary is that the highest-value work here was not the scheduler at all. It was putting licence observability in place, because the estate had none, and three of six licence services turned out to be writing no log whatsoever.
What I would do differently
Audit the OS constraints before promising a phased rollout. The systemd version dictated the cgroup mode, which dictated that a mixed-OS pool has to move in one step. I found that mid-build.
Write the collector heartbeat before any real metric. I built the interesting metrics first and the liveness check afterwards, which is the wrong order when absence and zero look identical.
Test every enforcement limit by violating it. Reading configuration files would never have found the swap gap.
Check the age of your data before analysing it. Both retractions came from measurements that were accurate and unrepresentative.
Price the cheap alternative honestly. 95 held sessions against single-digit CPU means some of this pain is session management, which is far cheaper than a scheduler. A scheduler was still right for the licence-bound multi-day work, but the two problems are separable and only one needs a cluster.
What’s next
Two weeks of per-feature licence occupancy data, which will answer what is genuinely
batch-shaped with evidence rather than inference. Then the first real workload, which should be
the place-and-route jobs: the clearest pain, the largest jobs, and the ones already invoked in a
way that makes sbatch a wrapper rather than a change. After that, submit hosts, and a careful
conversation about which interactive machines give up capacity and which never will.